

What Python actually is
Python is a programming language. That is all. It is not a magic tool, a financial platform, or a replacement for your risk system. It is a way of writing instructions that a computer will follow, and it happens to be written in a way that humans can read without having to understand cryptic symbols.
When you write Python code, you are telling a computer to do something step by step. Read this file. Look at the rows where this column equals that value. Add these numbers together. Write the result to a spreadsheet. Send an email. It is all explicit, all understandable, and all repeatable.
The key design principle behind Python is readability. The language prioritises code that looks like English. Compare this to older languages like C or Fortran, where the same instruction looks like a line of special characters. Readability matters because you will read code more often than you write it, and because code written in a rush often needs to be read by someone else under pressure three months later.
The other design choice that matters is that Python is not compiled. You do not need to convert your code into a binary that your computer understands before it runs. You write the code, you run it, and the Python interpreter reads it line by line and executes your instructions. This makes it slower than compiled languages like C or Java, but it makes it vastly faster to write and test. In finance, almost all of our bottlenecks are human time, not computer time.
Why Python works for finance
Python works for finance because finance work is mostly data work.
You read data from many sources: files, databases, market feeds, your risk system, regulatory templates. You reshape it, check it, calculate against it, and write results back out. You do this repeatedly. You do it under pressure. You do it with numbers that matter. You need to be able to show your work.
Excel is designed for a person sitting in front of a screen. It is brilliant for that. But it has limits. You cannot easily read a 10 million row file. You cannot easily version control a spreadsheet to show what changed and when. You cannot easily run the same calculation against data that arrives in different formats. You cannot easily build an audit trail that satisfies a regulator.
Python is designed for all of those things. It treats data and calculation as first class concepts. The language itself is simple enough that you can learn it in weeks, not months. The ecosystem of libraries around Python has already solved the common finance problems, so you do not need to build everything from scratch.
In practice, Python in finance work means writing scripts. A script is a text file containing Python code that does one job from start to finish. Read the data. Do the work. Write the output. The script is a record of exactly what you did and how you did it. You can run it again next week and get the same result. You can show it to your manager or your auditor. You can change one line and run it again if the requirement changes.
Three things Python does better than Excel or manual work
Example 1: Reading and reshaping a data feed
Your treasury system exports a position file every morning as a CSV with columns for instrument, tenor, currency, notional, rate, and position ID. You need to load this into your internal reporting format, which groups by currency and sums notional by tenor, and adds a reference date and report ID to every row.
In Excel, you would open the file, create a pivot table or use manual formulas, copy and paste special to values, add columns for the metadata, then save it as a new file. This takes 10 to 15 minutes and if the instrument list grows to 10,000 rows instead of 5,000, it starts to slow down. If the file format changes slightly (a new column is inserted, or the column order changes), you need to redo the formulas.
In Python with pandas, you write a script once and run it every day in 30 seconds:
import pandas as pd
from datetime import datetime

# Read the export file
positions = pd.read_csv('treasury_positions.csv')

# Group by currency and tenor, sum notional
grouped = positions.groupby(['currency', 'tenor'])['notional'].sum().reset_index()

# Add metadata
grouped['reference_date'] = datetime.now().date()
grouped['report_id'] = 'TREAS_' + datetime.now().strftime('%Y%m%d')

# Write output
grouped.to_csv('reporting_format.csv', index=False)
What does this save you? First, it is fast. Second, it is resilient. If a new instrument type is added, you do not need to change the script. If the file grows to a million rows, it still takes 30 seconds. Third, it is auditable. Anyone can read this script and understand exactly what happened. Fourth, if you discover an error, you can fix the script and run it again against the original file. You do not need to remember which manual steps you did.
Example 2: Calculating a regulatory metric automatically
You report the Liquidity Coverage Ratio (LCR) every month. The calculation requires reading inflow and outflow assumptions from a reference file, applying them to your balance sheet data, calculating net cumulative cash flow by time bucket, and then computing the ratio from a defined numerator and denominator. The calculation is deterministic, the inputs change monthly, and the output feeds a regulatory return.
Doing this in a spreadsheet means a large interconnected model where one cell refers to ten others. If you change an assumption file, you need to recopy values into the model. If someone else runs it, they might not follow the same sequence of steps and get a different result. If the regulator asks for a recalculation with slightly different assumptions, you need to do it all again.
With Python, you write a script that reads the inputs, runs the calculation, logs what happened, and writes the output:
import pandas as pd
import numpy as np

# Read reference data
assumptions = pd.read_csv('lcr_assumptions.csv')
balance_sheet = pd.read_excel('balance_sheet.xlsx', sheet_name='positions')

# Merge and calculate inflows and outflows
merged = balance_sheet.merge(assumptions, on=['instrument_type', 'currency'])
merged['inflow'] = merged['notional'] * merged['inflow_rate']
merged['outflow'] = merged['notional'] * merged['outflow_rate']

# Calculate net cash flow by time bucket
cash_flow_by_bucket = merged.groupby('time_bucket')[['inflow', 'outflow']].sum()
cash_flow_by_bucket['net'] = cash_flow_by_bucket['inflow'] - cash_flow_by_bucket['outflow']
cash_flow_by_bucket['cumulative'] = cash_flow_by_bucket['net'].cumsum()

# Calculate LCR numerator (liquid assets)
hqla = balance_sheet[balance_sheet['is_hqla'] == True]['notional'].sum()

# Calculate LCR denominator (net cumulative stress cash outflow, 30 day bucket)
stress_outflow = abs(cash_flow_by_bucket.loc['30_day', 'cumulative'])

lcr_ratio = (hqla / stress_outflow) * 100

print(f"LCR Ratio: {lcr_ratio:.2f}%")
print(f"HQLA: {hqla:,.0f}")
print(f"Stress Outflow: {stress_outflow:,.0f}")
The output includes logging. You can see exactly which inputs were used, what the intermediate calculations were, and what the final result is. The script is reproducible. If you run it again with the same data, you get the same answer. If the regulator asks for a variant, you change one line and run it again.
This example is illustrative. A production LCR calculation includes multiple time buckets, run off rates, and encumbrance treatments defined in the regulatory rules. The logic shown here is the conceptual skeleton.
Example 3: Building an audit trail for a daily process
Every morning your team manually reconciles yesterday's settlement data with your general ledger. Someone exports a settlement file, opens a spreadsheet, matches rows, flags exceptions, sends the exceptions to ops to fix, then marks the reconciliation as complete. The process is error prone and if someone is on holiday, it does not happen.
Python can automate this. You write a script that runs every morning at 6 am, reads the settlement file and GL extract, matches them by trade ID and settlement amount, flags any breaks, sends an email with the breaks to the ops team, logs what happened, and writes a reconciliation report:
import pandas as pd
from datetime import datetime
import smtplib
from email.mime.text import MIMEText

# Read source files
settlements = pd.read_csv('settlements_export.csv')
gl_extract = pd.read_csv('gl_extract.csv')

# Merge on trade ID
reconciliation = settlements.merge(
    gl_extract,
    on='trade_id',
    how='outer',
    suffixes=('_sett', '_gl'),
    indicator=True
)

# Flag breaks: settlements not in GL, GL not in settlements, or amount mismatch
reconciliation['break'] = (
    (reconciliation['_merge'] != 'both') |
    (abs(reconciliation['amount_sett'] - reconciliation['amount_gl']) > 0.01)
)

# Log results
log_line = f"{datetime.now().isoformat()} | Total: {len(settlements)} | GL: {len(gl_extract)} | Breaks: {reconciliation['break'].sum()}"
with open('reconciliation.log', 'a') as f:
    f.write(log_line + '\n')

# Write output
reconciliation[reconciliation['break'] == True].to_csv(
    f'breaks_{datetime.now().strftime("%Y%m%d")}.csv',
    index=False
)

# Send alert if breaks exist
if reconciliation['break'].sum() > 0:
    msg = MIMEText(f"Reconciliation break detected: {reconciliation['break'].sum()} exceptions")
    msg['Subject'] = 'GL Reconciliation Alert'
    msg['From'] = 'python@treasury.local'
    msg['To'] = 'ops@treasury.local'
    # (email send logic here)
What this gives you: automation, consistency, and an audit trail. The process runs the same way every day. If there are no breaks, nobody needs to do anything. If there are breaks, the ops team knows immediately. The log file shows when the reconciliation ran, what the inputs were, and what the result was. If you need to investigate a settlement from three weeks ago, you can see exactly what the reconciliation process did that day.
The ecosystem: why Python alone is not enough
Python itself is a core language with limited built in features. If you need to do something with data or mathematics, Python relies on libraries that other people have written and published.
For finance work, three libraries matter most:
pandas reads and manipulates data. It handles CSV files, Excel files, databases, and more. It provides data frames, which are like spreadsheets in memory, and a vast range of operations to filter, group, reshape, and calculate. Most of your daily work will use pandas.
NumPy provides numerical computing tools. It handles arrays, matrix operations, statistical functions, and mathematical routines. You will use NumPy less often than pandas, but it sits underneath pandas and provides the speed when you need to calculate across millions of rows.
requests and similar libraries handle communication: reading data from web APIs, connecting to databases, sending files to systems. These bridge the gap between Python and the world around it.
There are also libraries for specific finance tasks: building model portfolios, calculating risk metrics, working with market data, generating reports in specific formats, connecting to Bloomberg or Reuters.
The point is that you do not write these libraries yourself. They exist, they are well maintained, and they are free. You import them and use them. This is where the real productivity gain comes from. You are standing on the shoulders of work that thousands of people have done, refined, and donated.
You do not need to install these libraries yourself if you are using Python in a corporate environment. Often your IT team has already installed them, or you use an enterprise platform like Anaconda that comes with them pre installed.
What Python is not good at
Python will not replace your risk system. It is not a database. It is not a trading system. It is not a regulatory submission tool. It is not fast enough for high frequency calculations on huge datasets (though it is faster than you would guess).
Python is also not good for graphical user interfaces. If you need something that a person without technical background can click on without understanding code, Python is not the best choice. You would want a web application or a custom system built by a proper software team.
Python is not a tool for someone who wants to point and click. You must write code. This is a feature for people who want precision and repeatability, but it is a barrier if you are not willing to learn to read and write code.
Python is also not a substitute for understanding the business logic. If you do not understand how to calculate the LCR, you cannot write a Python script to calculate it. Python is a tool that lets you express what you know with precision and automation. It does not create knowledge.
How to learn without breaking anything
The safest way to start is on your own machine, in your own time, with data that does not matter.
Download Python from python.org. Install it. Open a command line or terminal. Type python and you will get an interactive prompt where you can type code and see the result immediately. This is called REPL: Read, Evaluate, Print, Loop. It is the best way to learn because you can type a line, see what happens, and adjust.
Better yet, install an IDE (Integrated Development Environment) like VS Code or PyCharm. These are free, professional tools that let you write Python code with proper editing, error checking, and built in terminal. You can open a file, write a script, and run it.
Start small. Read a CSV file. Print it out. Add a column. Sum a column. Write it back to a file. Do this with test data that you create yourself, not with live data from your systems.
Once you are comfortable, move to a test environment. Get a copy of a real data file, run your script against it, and compare the output to a version you calculated manually to make sure it is correct. Once you are confident, think about moving to production.
For production use, you want version control. This means using a system like Git where every version of your code is stored and you can see who changed what and when. This is non negotiable if someone else ever needs to run your script or if you need to audit what you did. Most firms already use Git or have a code repository. Ask your IT team.
The time cost and the payoff
Learning Python takes time. To be comfortable enough to write simple scripts, plan for 40 to 60 hours of focused learning. This is not trivial. It is several weeks of evenings and weekends, or a few days if you do an intensive course.
To be proficient enough to write scripts that handle edge cases, deal with multiple data formats, and work reliably in a production environment, plan for several months of regular practice.
But here is the payoff. Once you know how to write a script, a task that takes 20 minutes manually takes 5 minutes to script the first time and 30 seconds to run every time after that. If you do that task weekly, you save 15 minutes a week. Over a year, that is 13 hours. If you script five such tasks, you have saved 65 hours a year. The time to learn Python pays for itself in the first few months.
The second payoff is quality. Manual processes are error prone. A spreadsheet formula that you enter wrong will give you the wrong answer until someone notices. A Python script will do the same thing consistently. You can test it, version control it, and audit it. If it has a bug, you fix it once and it is fixed everywhere.
The third payoff is repeatability. With a script, you can recalculate last month's report with new assumptions in seconds. You can run the same process against different datasets. You can hand the script to someone else and they will get the same answer.
The fourth payoff is integration. Once you know Python, you can build workflows that connect systems that do not normally talk to each other. You can read from your risk system, manipulate the data, write to your reporting platform, and send an email, all in one script.
Where to start: your first script
Pick a task that you do weekly or monthly. Something that involves reading data, doing some calculation or reshaping, and writing output. It should be something that takes you 15 to 30 minutes to do manually. It should be a task where you do the same thing each time.
For many people, this is reading a file, doing some filtering or grouping, and producing a report. For others, it is reconciling two sources of data. For others, it is extracting data from a system and transforming it for another system.
Write the script to do that one task. Test it thoroughly with test data. Get someone else to read it and make sure it makes sense. Then run it in production.
Document what it does in comments. Explain why you made the choices you did. Explain what data formats it expects and what it produces.
If it works, pick the next task. If it breaks, fix it, learn from it, and move to the next task.
After a few months of weekly practice, you will find that the time you spend writing scripts is repaid many times over in time saved running them. You will also find that your work is more accurate, more auditable, and easier to explain to others.
That is where the real value lies. Not in being a programmer. You are not a programmer. You are a treasury or risk analyst who knows how to write code. The code is a tool, like Excel or SQL. It makes you more effective at your job.
Next: load a real cash flow file into pandas and build a simple bucketed view of a position. That is where these fundamentals start to pay off.
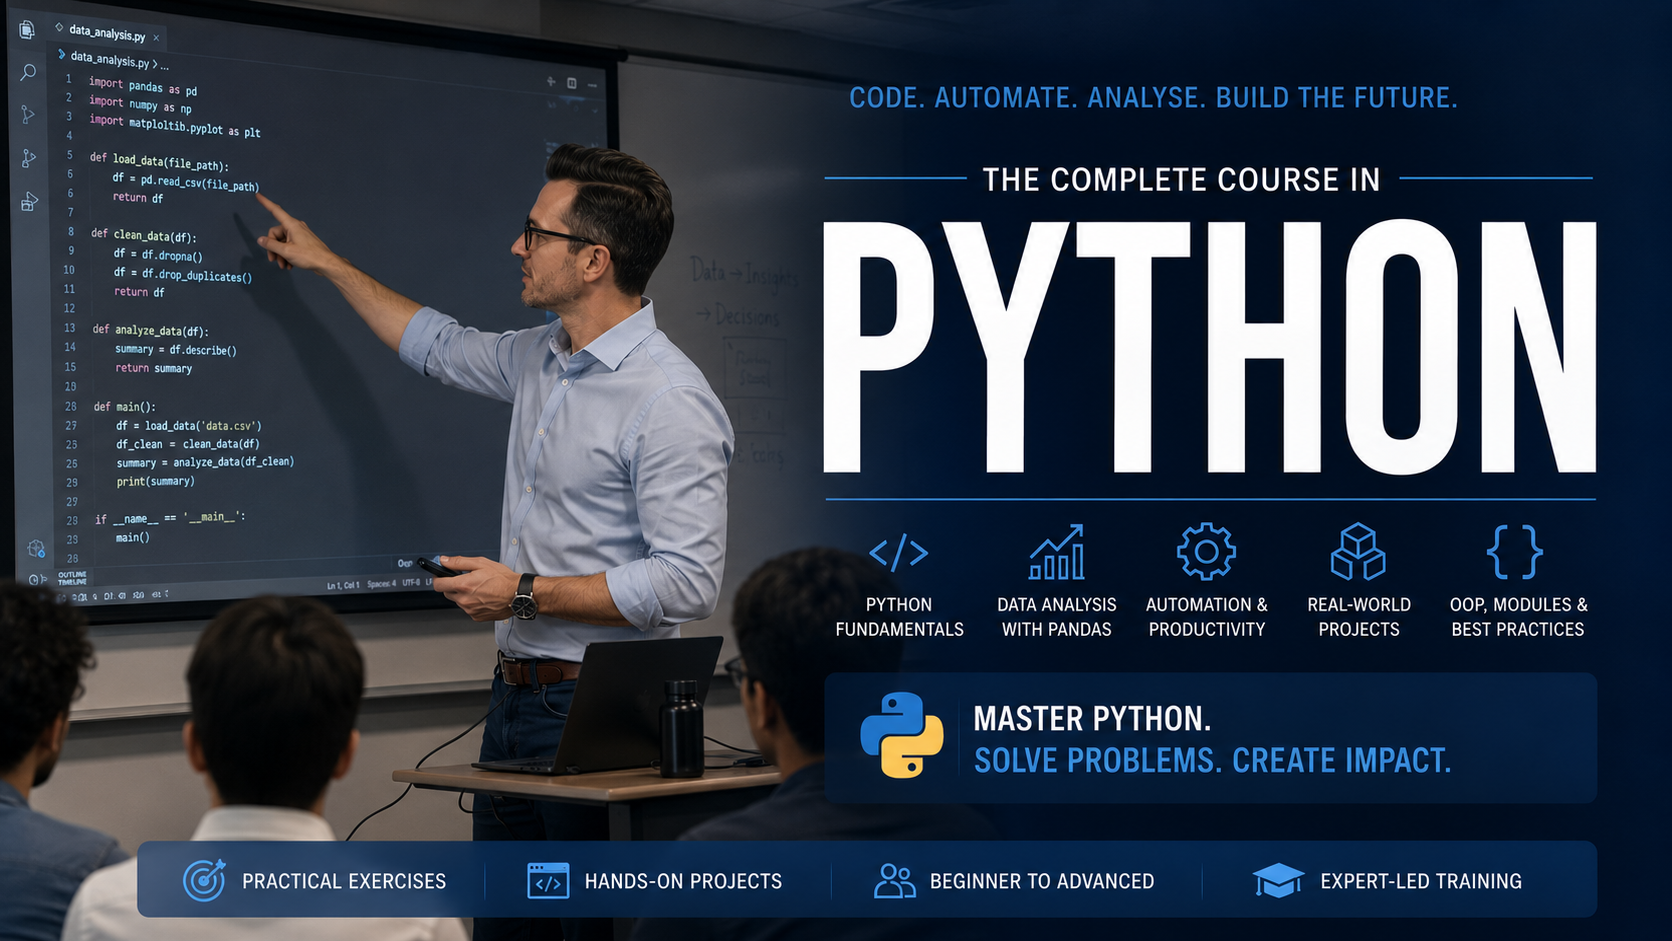
The Complete Python Course
Welcome to the most practical and beginner friendly Python Bootcamp Course on YouTube.
Take the courseGet the next one in your inbox
A weekly note across Finance & Treasury, Innovation & Automation and Career Development. No spam, unsubscribe any time.
Notes across finance and treasury, innovation and automation, and career development, written by practitioners who do the work.


